DATA 1500 Final Project
Do Some Dogs Bite More,
Or Are They Just More Popular?
An analysis of New York City dog bite reports and dog licensing records by breed group.
Which Dogs Are Most Associated With Bite Reports?
This project uses New York City dog bite reports from the Department of Health and Mental Hygiene and dog licensing records maintained by the city. Together, they allow us to compare reported incidents with how common each type of dog is.
A simple count of bite reports can be misleading because some breed groups are much more common than others. If a type of dog is more popular, it naturally has more chances to appear in reported incidents.
To make the comparison more meaningful, I compare each breed group’s share of bite reports with its share of licensed dogs. This helps separate incident counts from underlying ownership patterns.
This approach allows us to identify which breed groups appear in bite reports more often than their population would suggest.


Examples of four selected AKC breed groups used in the charts.
Who Is Most Common?
Dog ownership is not evenly distributed across breed groups. In cities, those patterns are shaped by housing, lifestyle, and daily routines.
In dense environments like New York City, smaller or lower-maintenance dogs may be more practical in apartments, while larger or high-energy breeds may be less common. These choices create systematic differences in which types of dogs people own.
Before comparing bite reports, we first look at how dog ownership is distributed across breed groups.
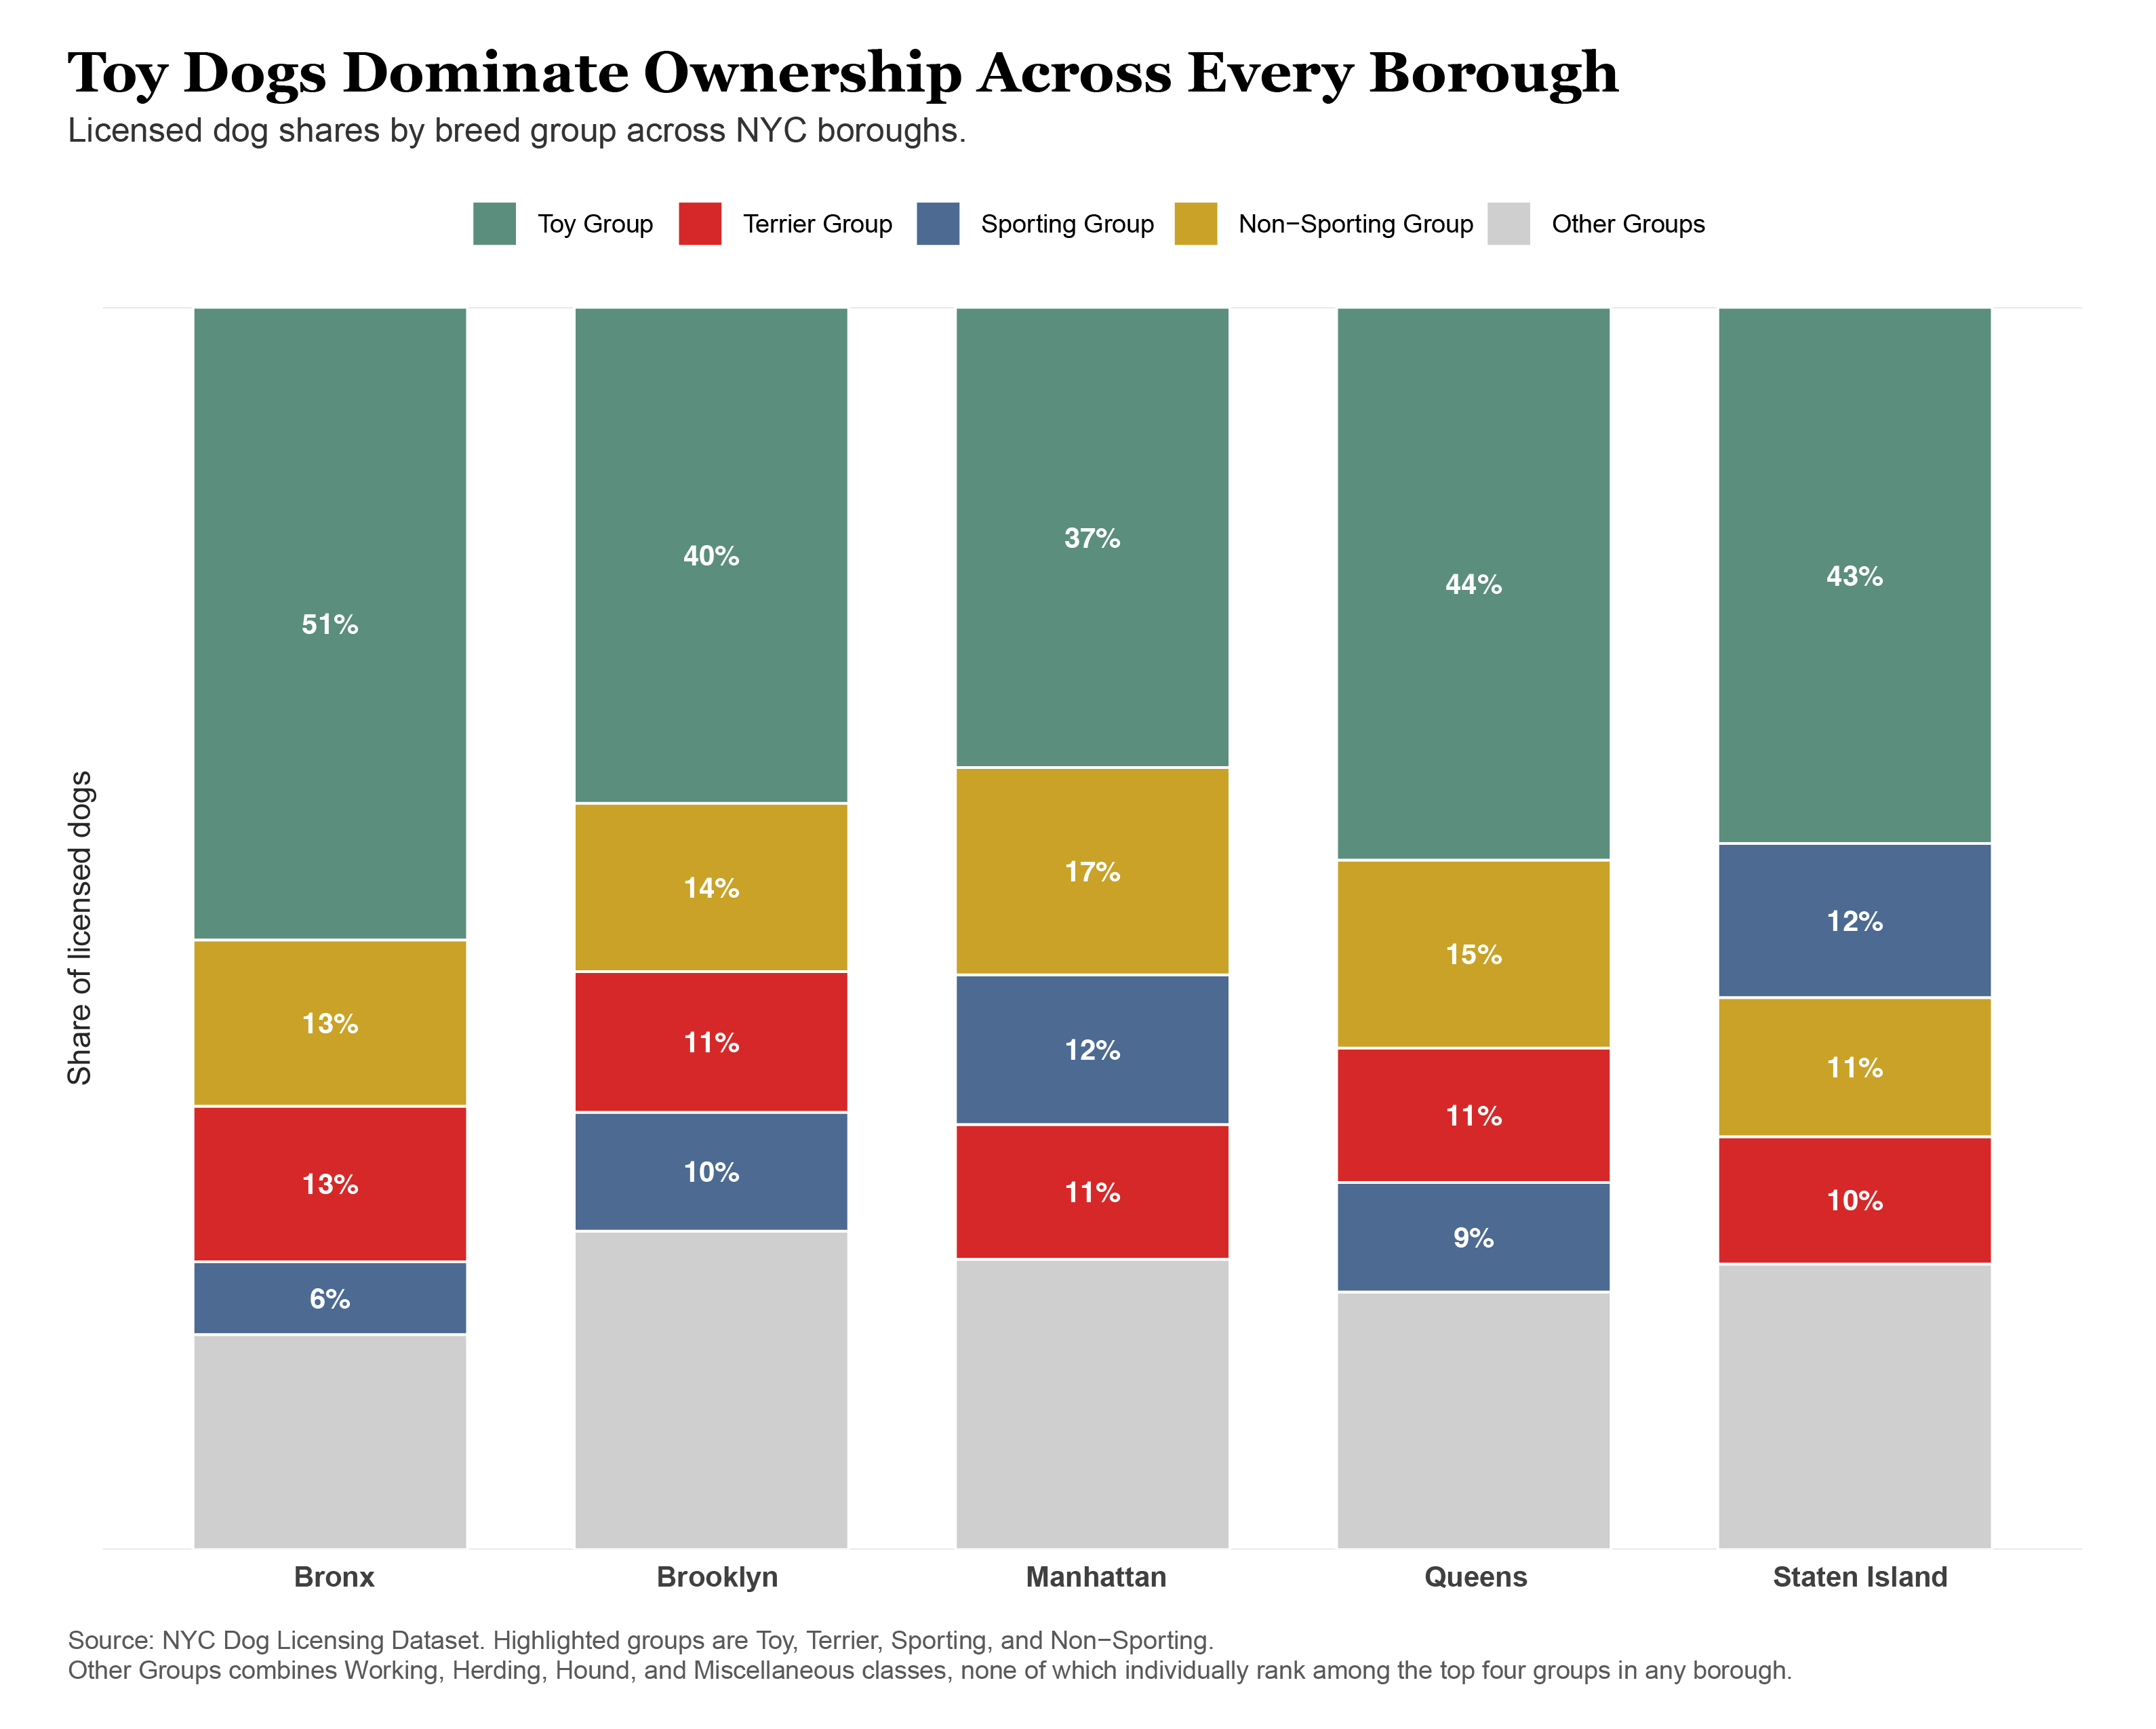
Toy groups dominate the licensed dog population across all boroughs. The rest of the distribution varies more: Sporting dogs rank higher in some areas, while Terrier groups shift up or down depending on location.
These patterns reflect how dog ownership differs across the city, shaped by housing, space, and neighborhood preferences. Together, they provide a baseline for understanding how common each group is.
Who Appears Most in Bite Reports?
When we turn to reported bite incidents, the pattern looks different. The groups that dominate ownership are not the same groups that appear most frequently in bite reports.
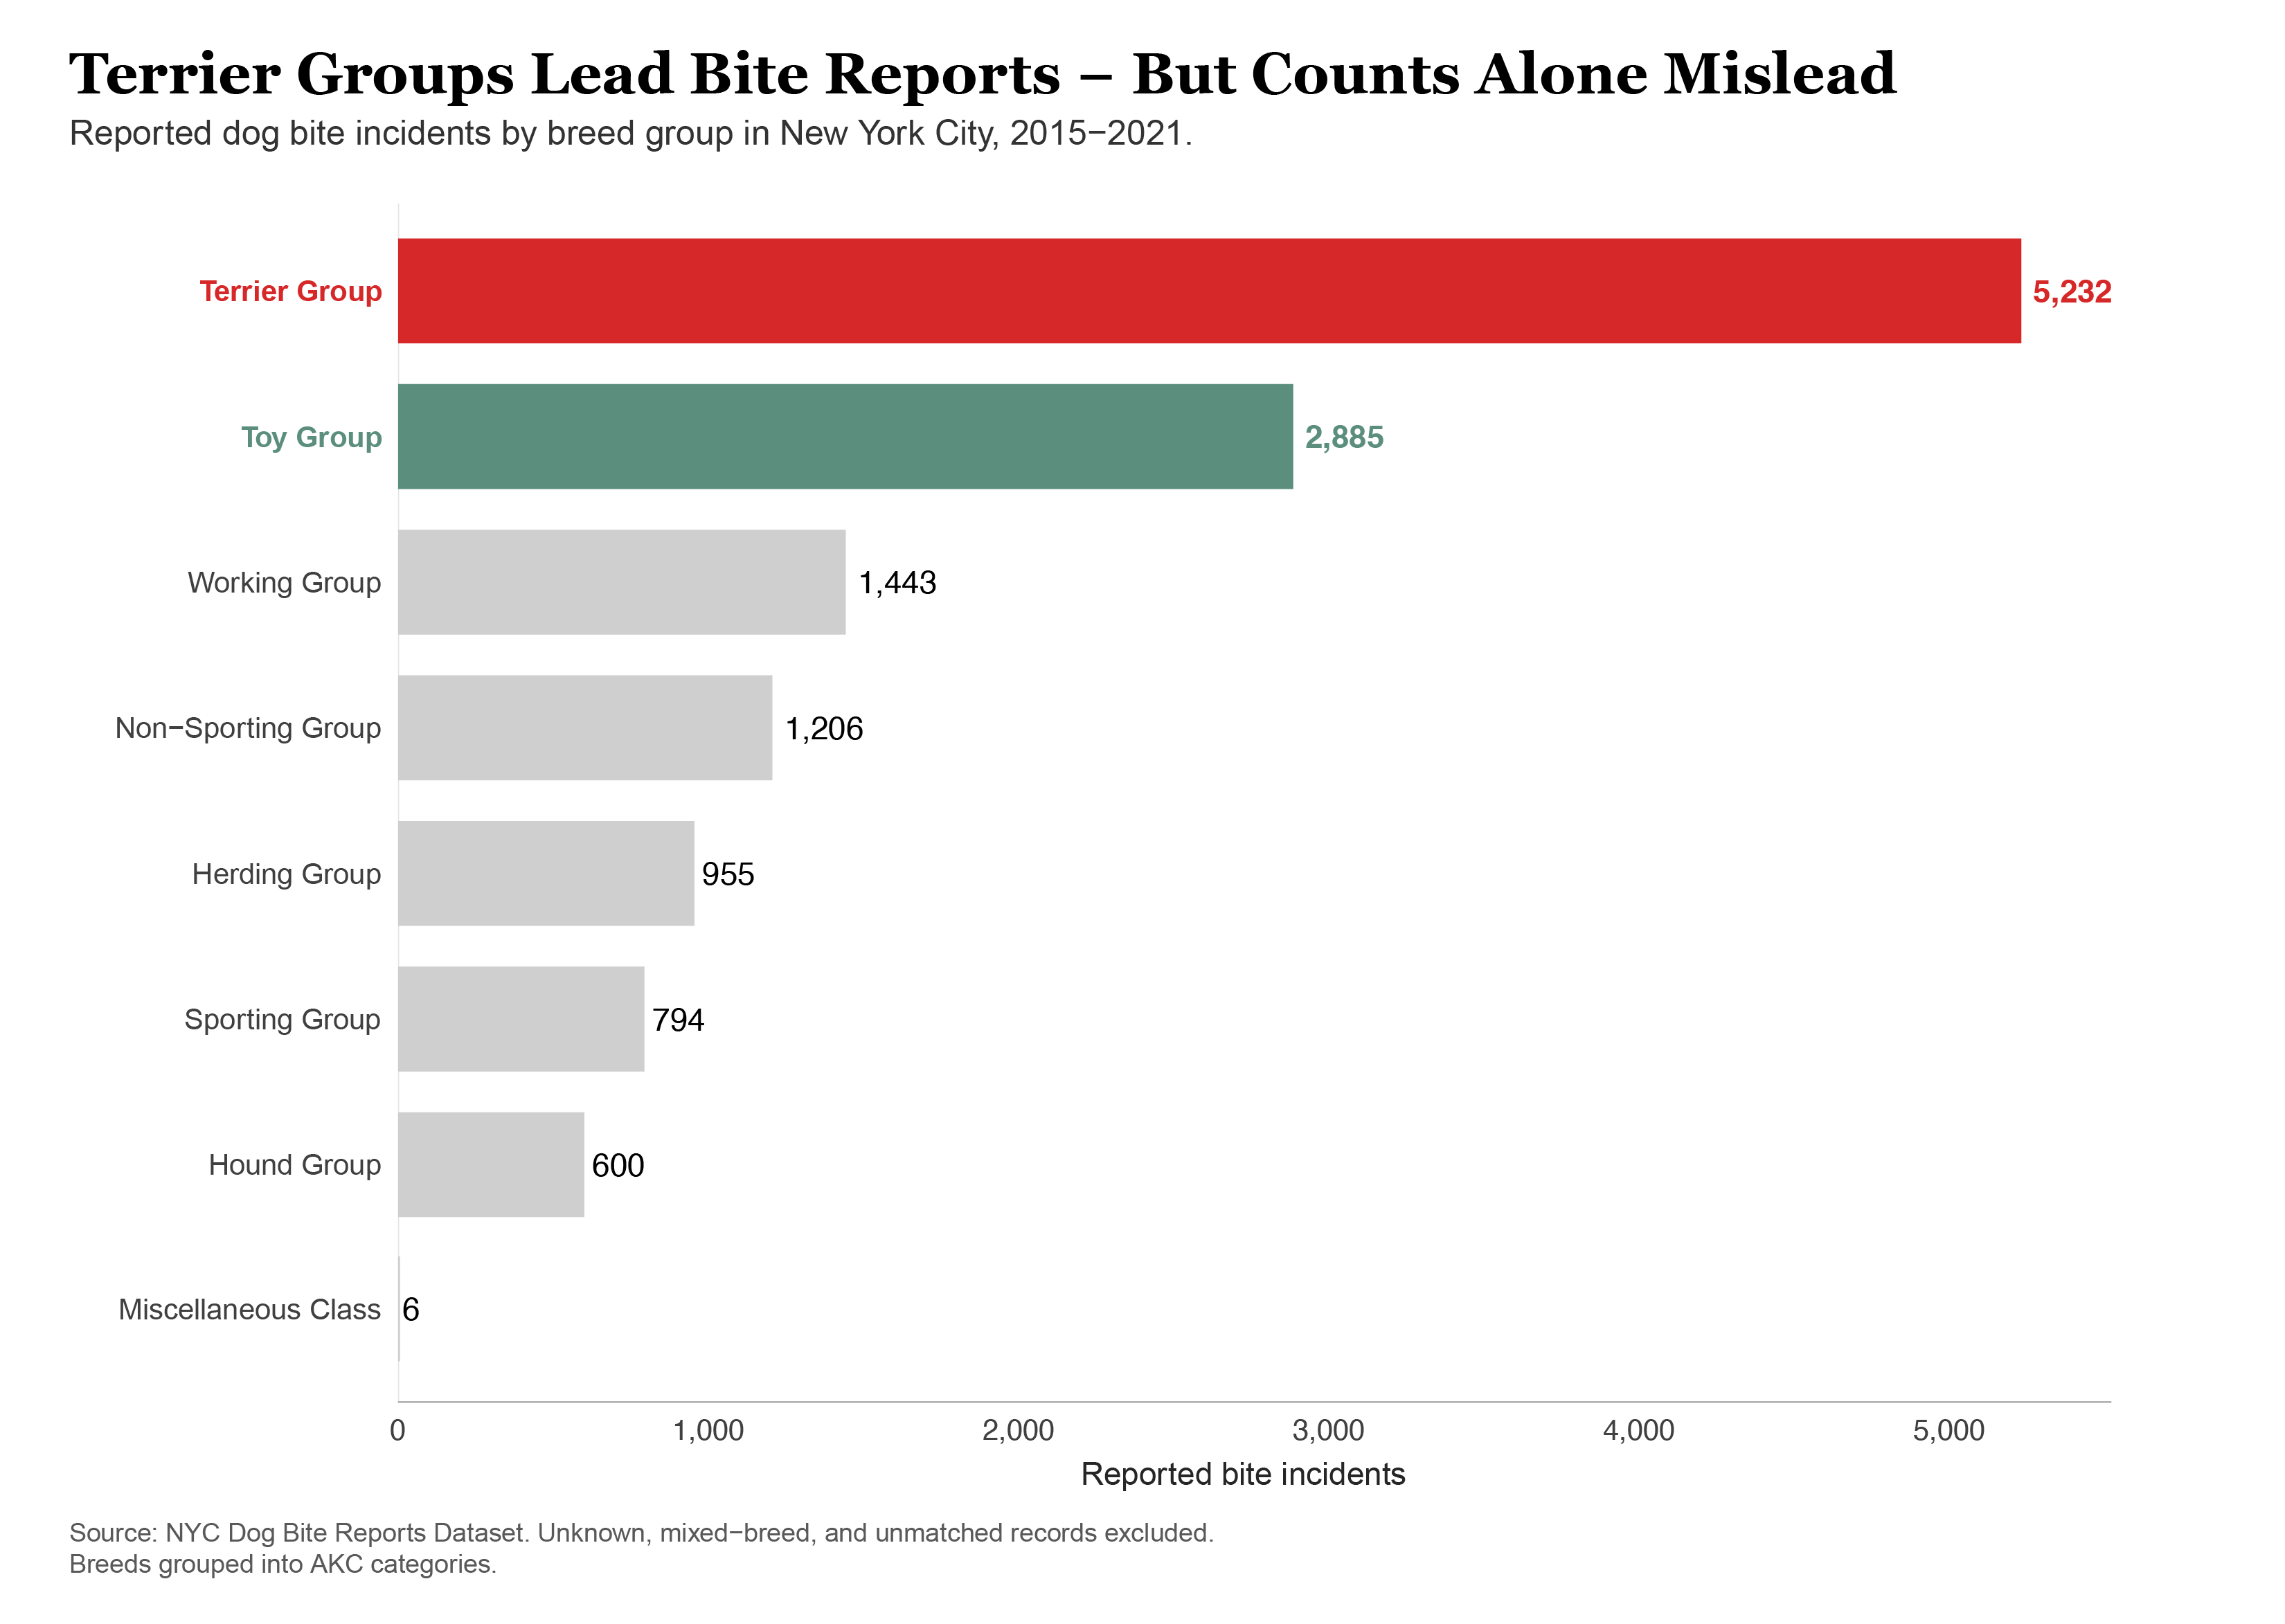
The difference becomes clear in the data. From 2015 through 2021, Terrier groups account for more reported bite incidents than any other breed category. Toy groups also stand out, ranking second and appearing far more often than most other groups.
At first glance, this may seem to confirm that some groups are simply more associated with bite reports. But raw counts alone do not tell us why. Higher totals may reflect how common a group is, how often incidents occur once those dogs are present, or both.
This ambiguity is exactly why ownership-adjusted comparisons matter. To understand whether a group appears more often than expected, we need to compare bite incidents with the underlying dog population.
Which Dogs Are More Likely to Appear in Bite Reports?
To answer that question, we compare each group’s share of licensed dogs with its share of reported bite incidents. If incidents simply followed popularity, every point would fall near the diagonal reference line. Groups above the line appear in bite reports more often than their population share would suggest, while those below appear less often.
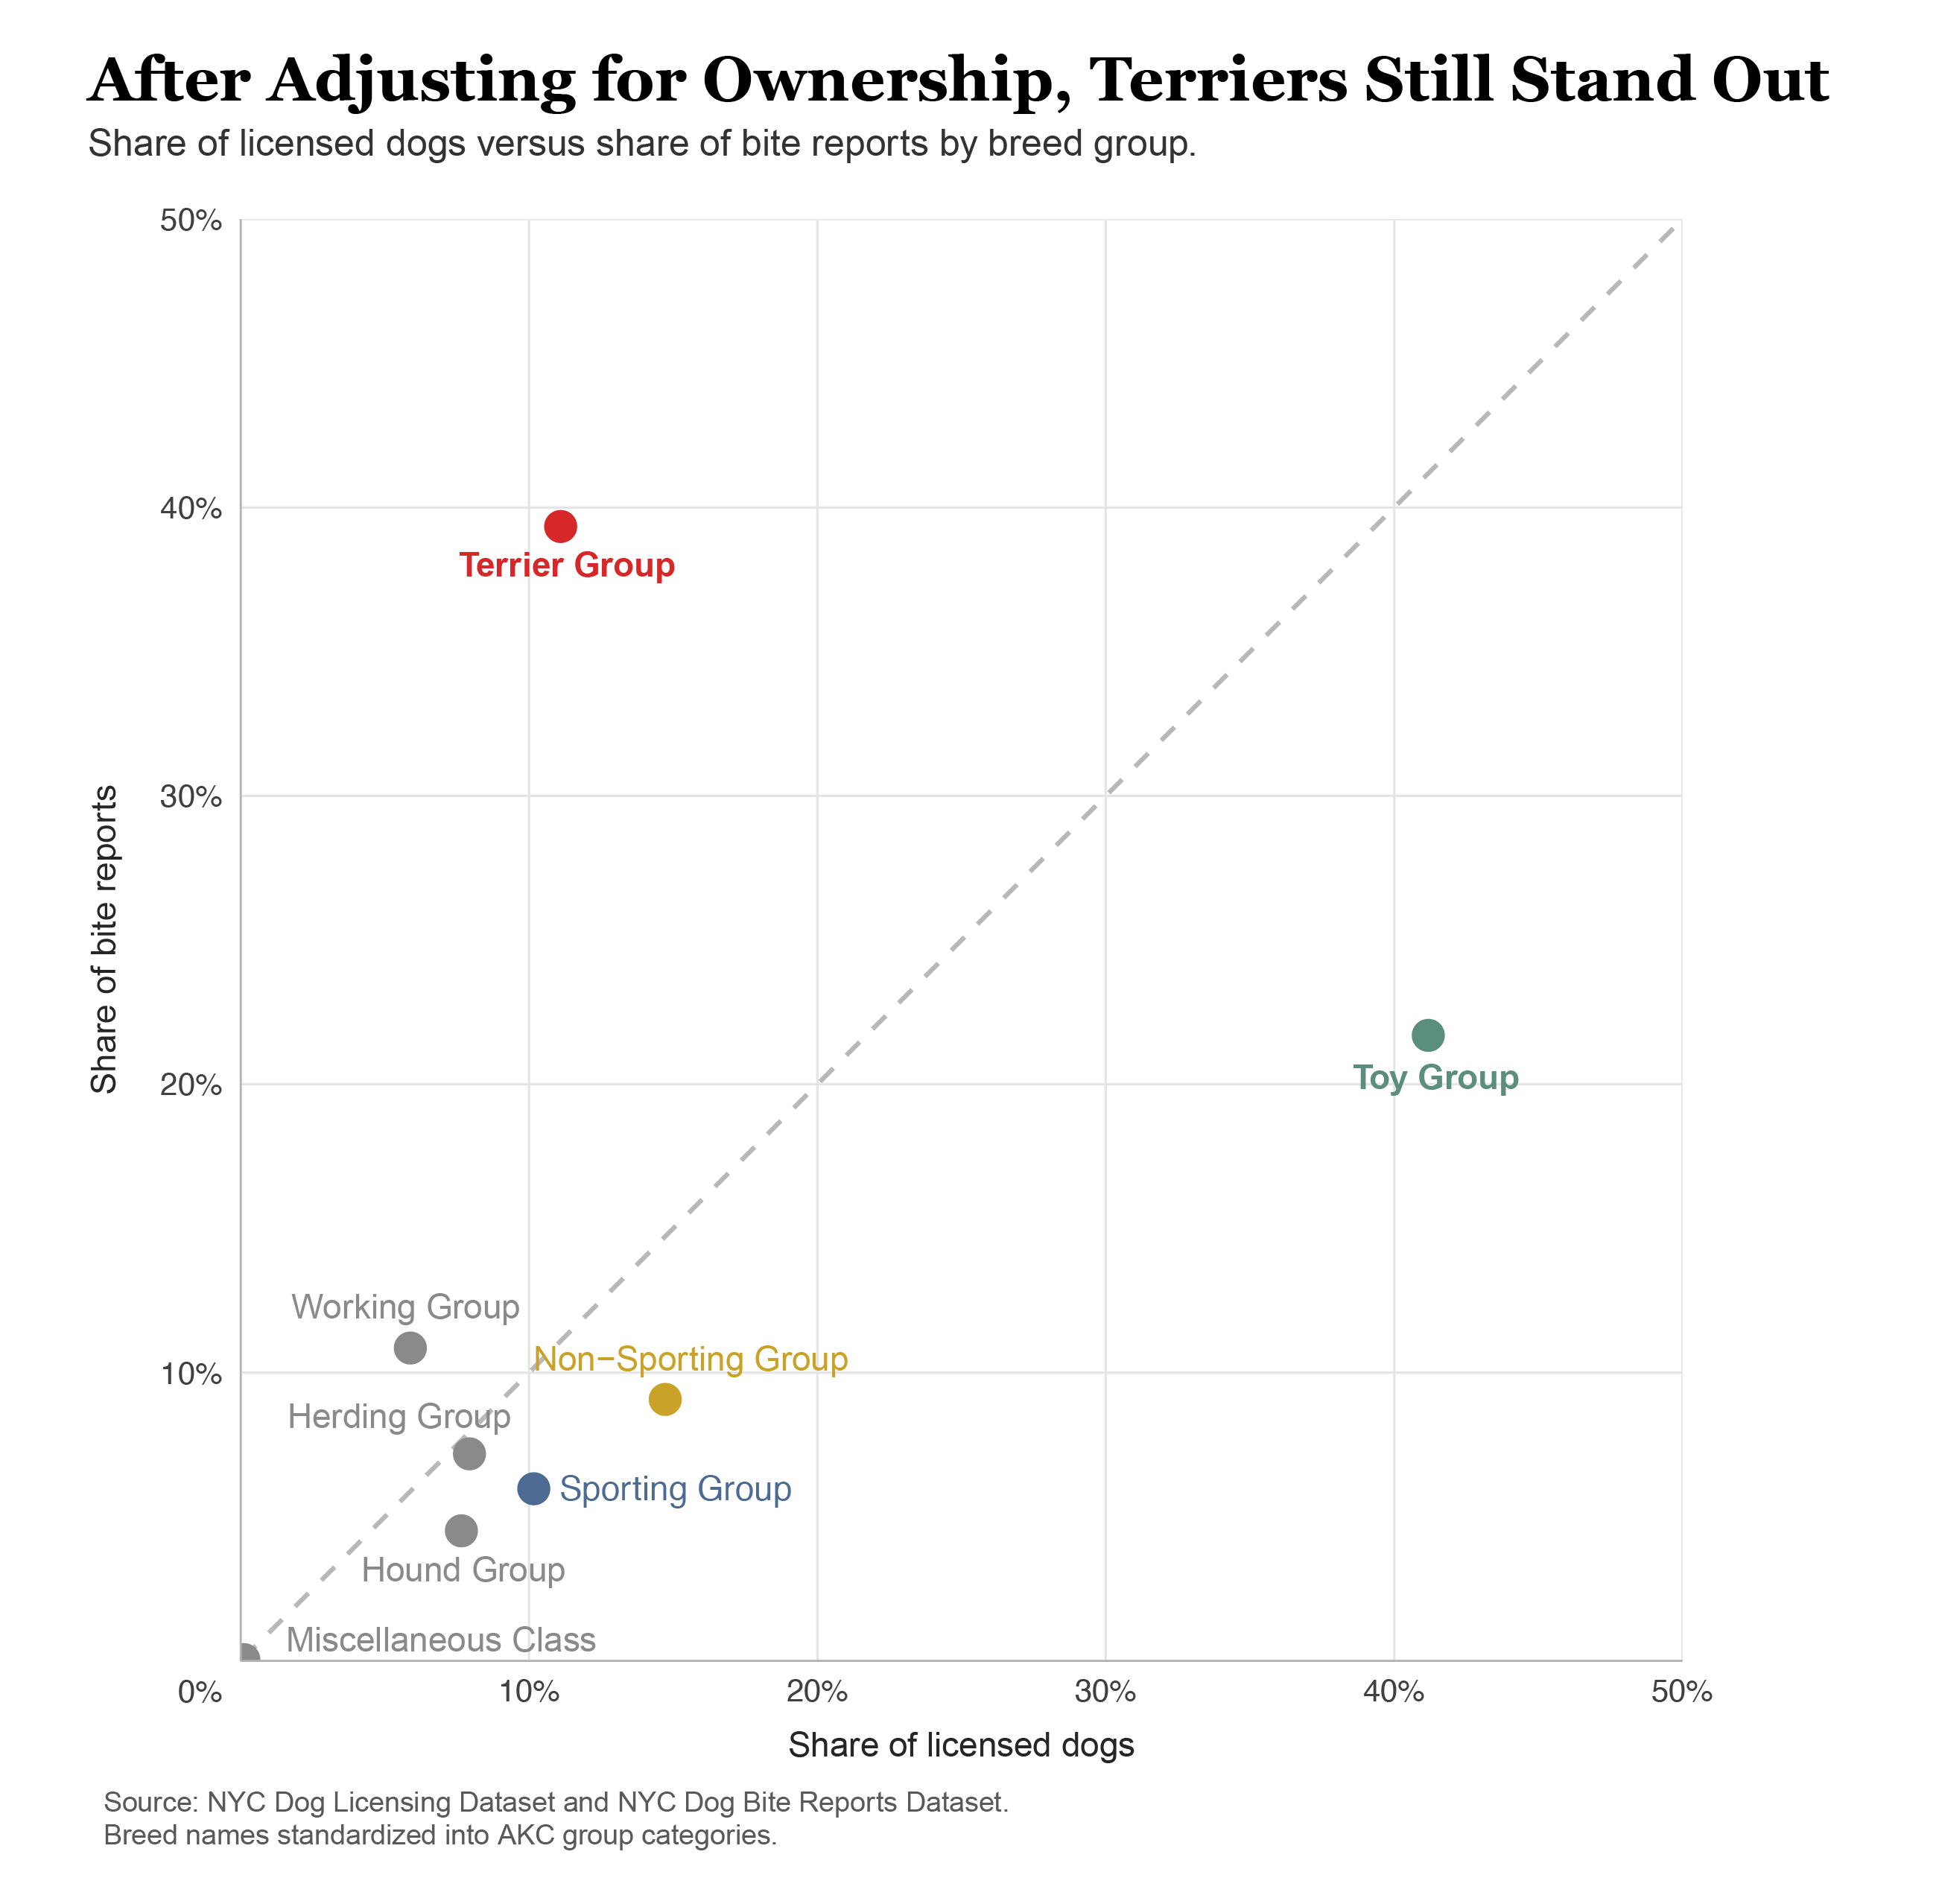
The pattern becomes clear once ownership is taken into account. Terrier groups sit well above the diagonal, appearing in bite reports more often than their population share would suggest.
Toy groups fall below the line. Despite being the most common dogs in the city, they account for a smaller share of bite reports than their population would suggest. Most other groups cluster closer to the diagonal, where incident share more closely tracks ownership.
This provides the clearest answer in the project: after accounting for how common each group is, Terrier dogs stand out as the most overrepresented in bite reports.
Where Do Terrier Bite Reports Stand Out the Most?
After accounting for how common each group is, Terrier dogs still appear more often in bite reports than expected. The next question is where that difference is most pronounced across the city. The map shows the share of reported dog bites in each ZIP code that involve Terrier groups.
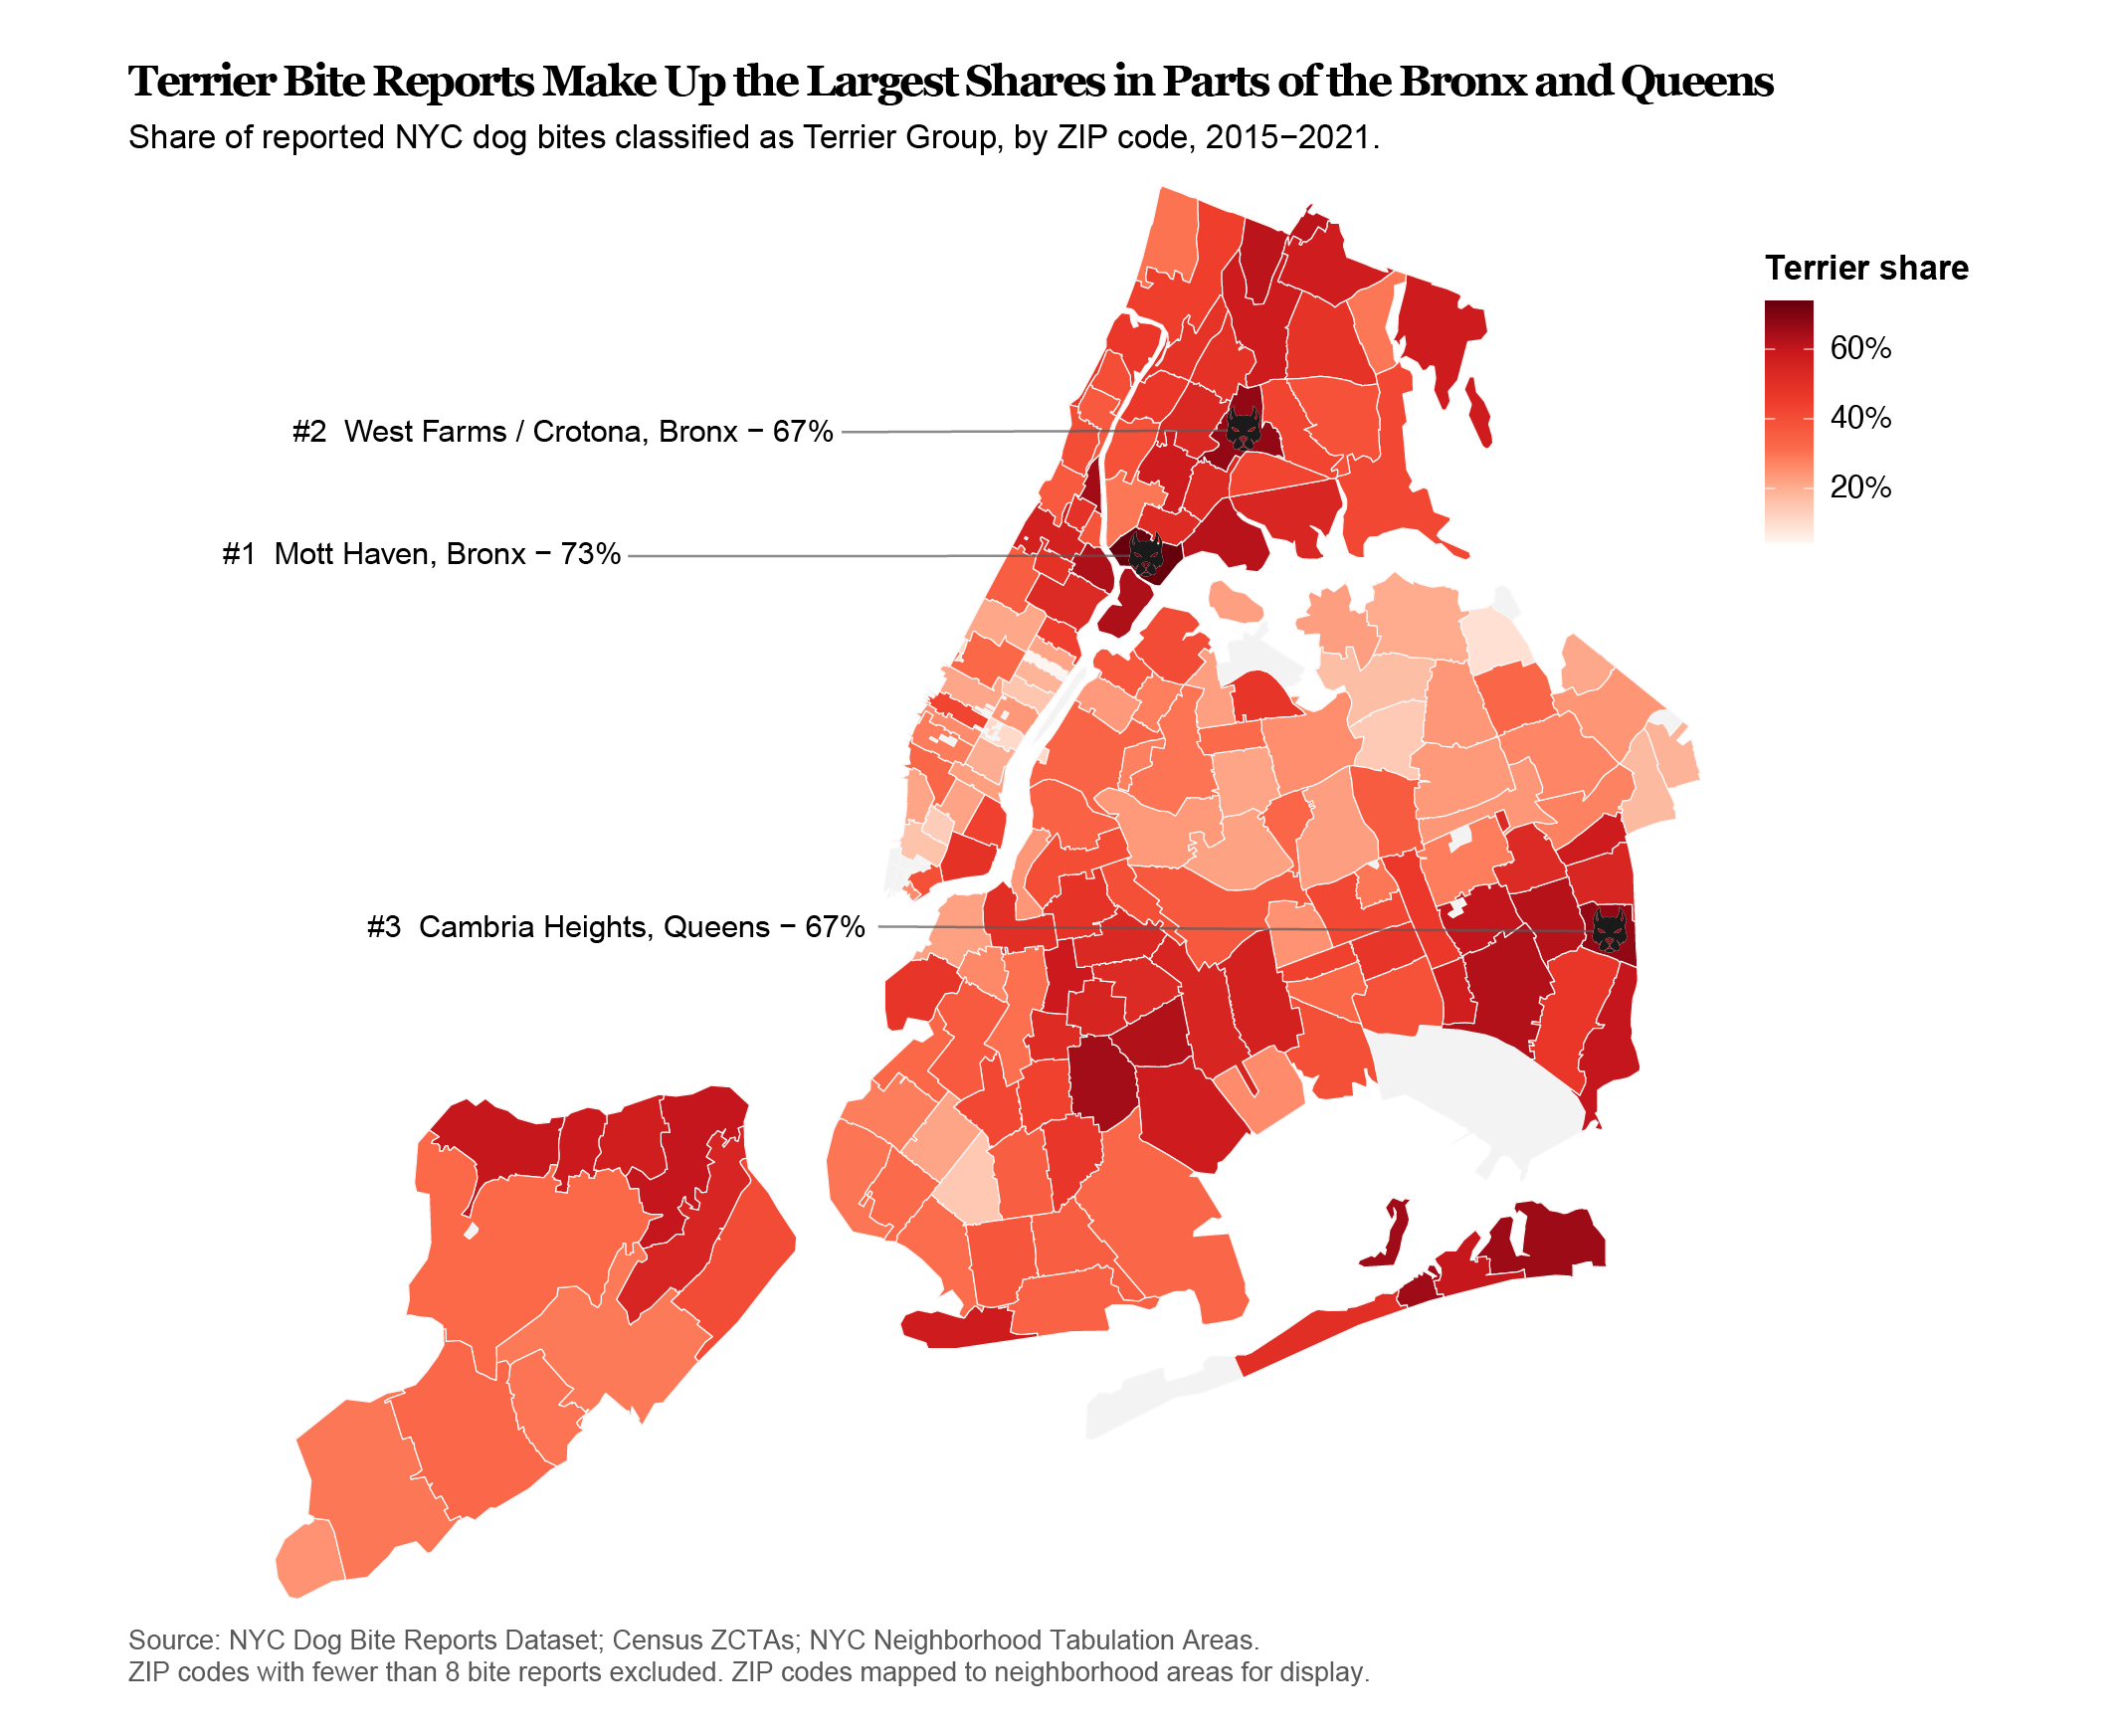
These patterns should be interpreted with caution. A higher share of Terrier-related bite reports does not necessarily mean these areas have more dangerous dogs.
Instead, these differences may reflect local conditions — including ownership patterns, housing environments, pedestrian activity, and reporting behavior.
With that in mind, several areas in the Bronx and Queens stand out, where Terrier-related incidents make up a larger share of reported bites. In these neighborhoods, it may be worth being more aware of the types of dogs present and the situations where interactions are more likely.
Conclusion
Taken together, these charts show that looking at bite reports alone can be misleading. Once ownership is taken into account, Terrier groups stand out most clearly — not because they are the most common, but because they appear more often than their population would suggest.
At the same time, these patterns should not be read as a simple ranking of “good” or “bad” dogs. Reported bite incidents are shaped by many aspects of city life: housing, density, daily routines, public space, and how people interact with their dogs.
Dog bite data reveals as much about cities and people as it does about dogs.
Sources and Methods
This project uses New York City dog licensing records and New York City dog bite report records. Breed names were cleaned and standardized into American Kennel Club breed group categories. Unknown, mixed-breed, and unmatched bite records were excluded from the breed-group comparisons. ZIP codes with fewer than eight bite reports were excluded from the map to reduce instability from very small counts.
Data sources: NYC Dog Licensing Dataset, NYC Dog Bite Reports Dataset, U.S. Census ZCTA boundary files, and NYC Neighborhood Tabulation Areas.